Discovery & Connect
Endpoint discovery with None / Sign / Sign & Encrypt, anonymous or username/password, X.509 client certificates. Find servers via a discovery server (LDS, LDS-ME) or Bonjour, and keep connection profiles. A keepalive watches the session; after a drop the app resumes it or re-creates every subscription and monitored item on its own, and Retry Now skips the wait.
Several servers at once
Connect to several servers in parallel, each with its own traffic light in the sidebar. Switch with one click; the other connections keep their subscriptions and recordings running in the background.
All Servers Monitor
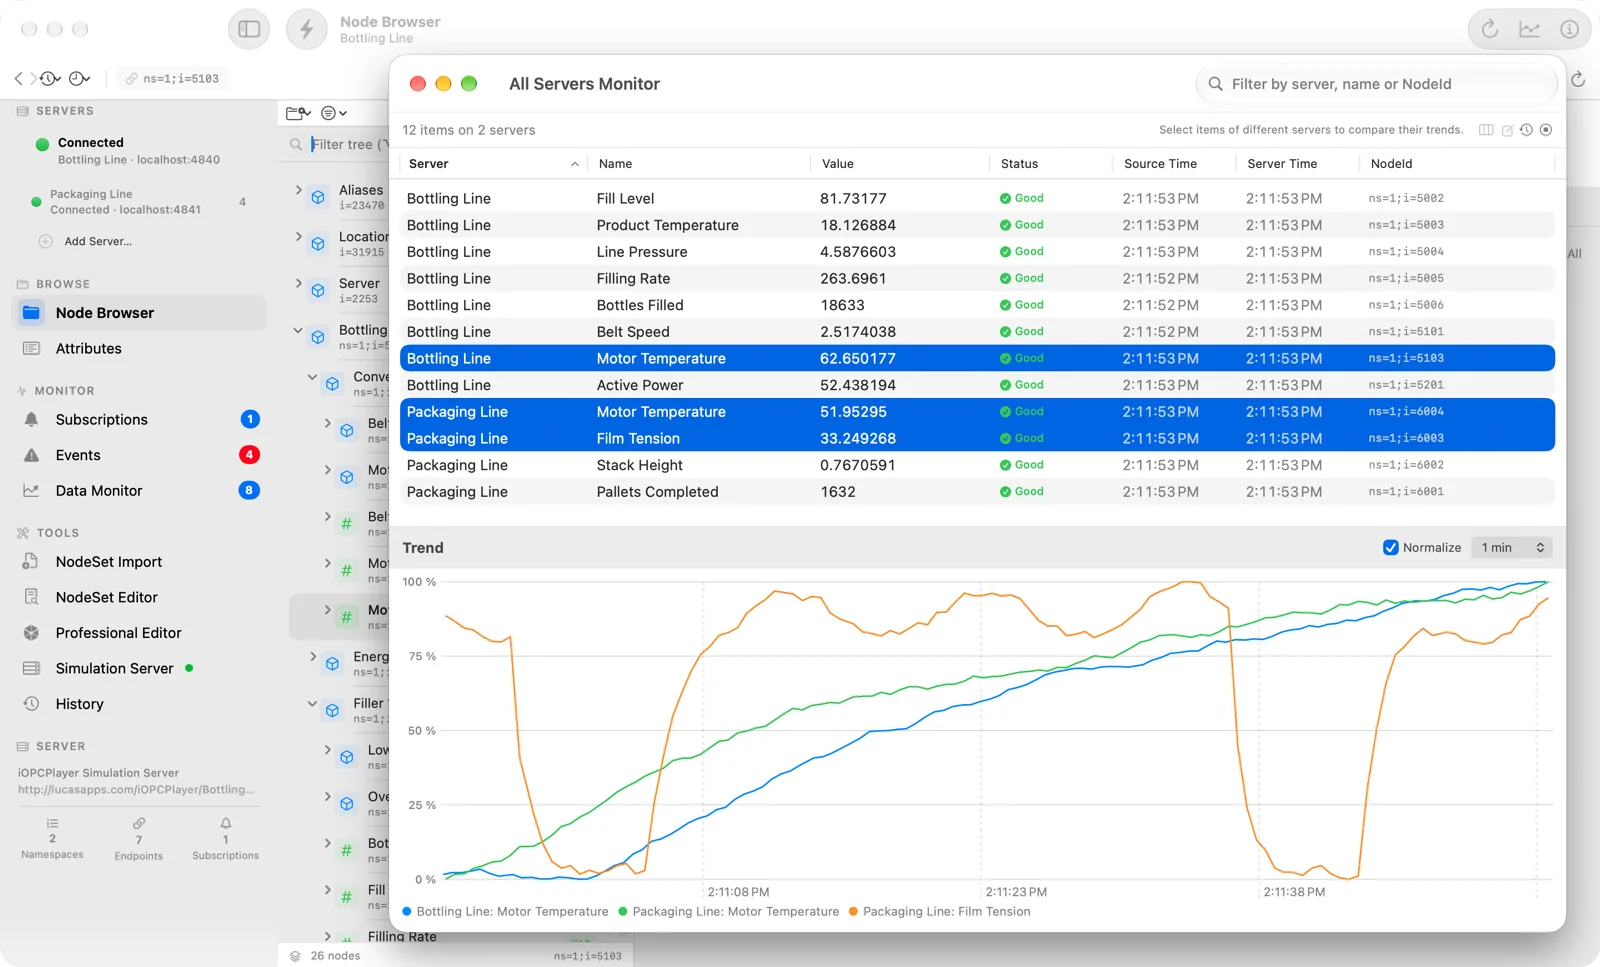
The monitored items of every connection in one table with a server column, stale markers and a shared trend of up to eight items from different servers. Compare on Other Servers finds the same node on the other connections by its browse path.
Workspaces
Every server remembers its subscriptions, monitored items and event monitor and offers to restore them on the next connect. Save complete multi-server setups as .iopcworkspace files (never with passwords), and import or export item lists as CSV or JSON.
Read-only for live plants
A read-only profile blocks writes, method calls, alarm acknowledgements, node management and history updates for that server, while browsing, reading, subscriptions and history reads keep working.
Reverse connect
When the plant firewall only allows outgoing connections, the server connects to your Mac (port 4844 by default). Only the expected server URI is accepted, and secure channels require a trusted certificate.
Certificate pinning
Trust-on-first-use for server certificates: check subject, validity and SHA-256 fingerprint, then pin it. If the server later presents a different certificate, a warning shows the old and new fingerprints, and replacing it needs a second confirmation. Certificates outside their validity period are never trusted.
Address-space browsing
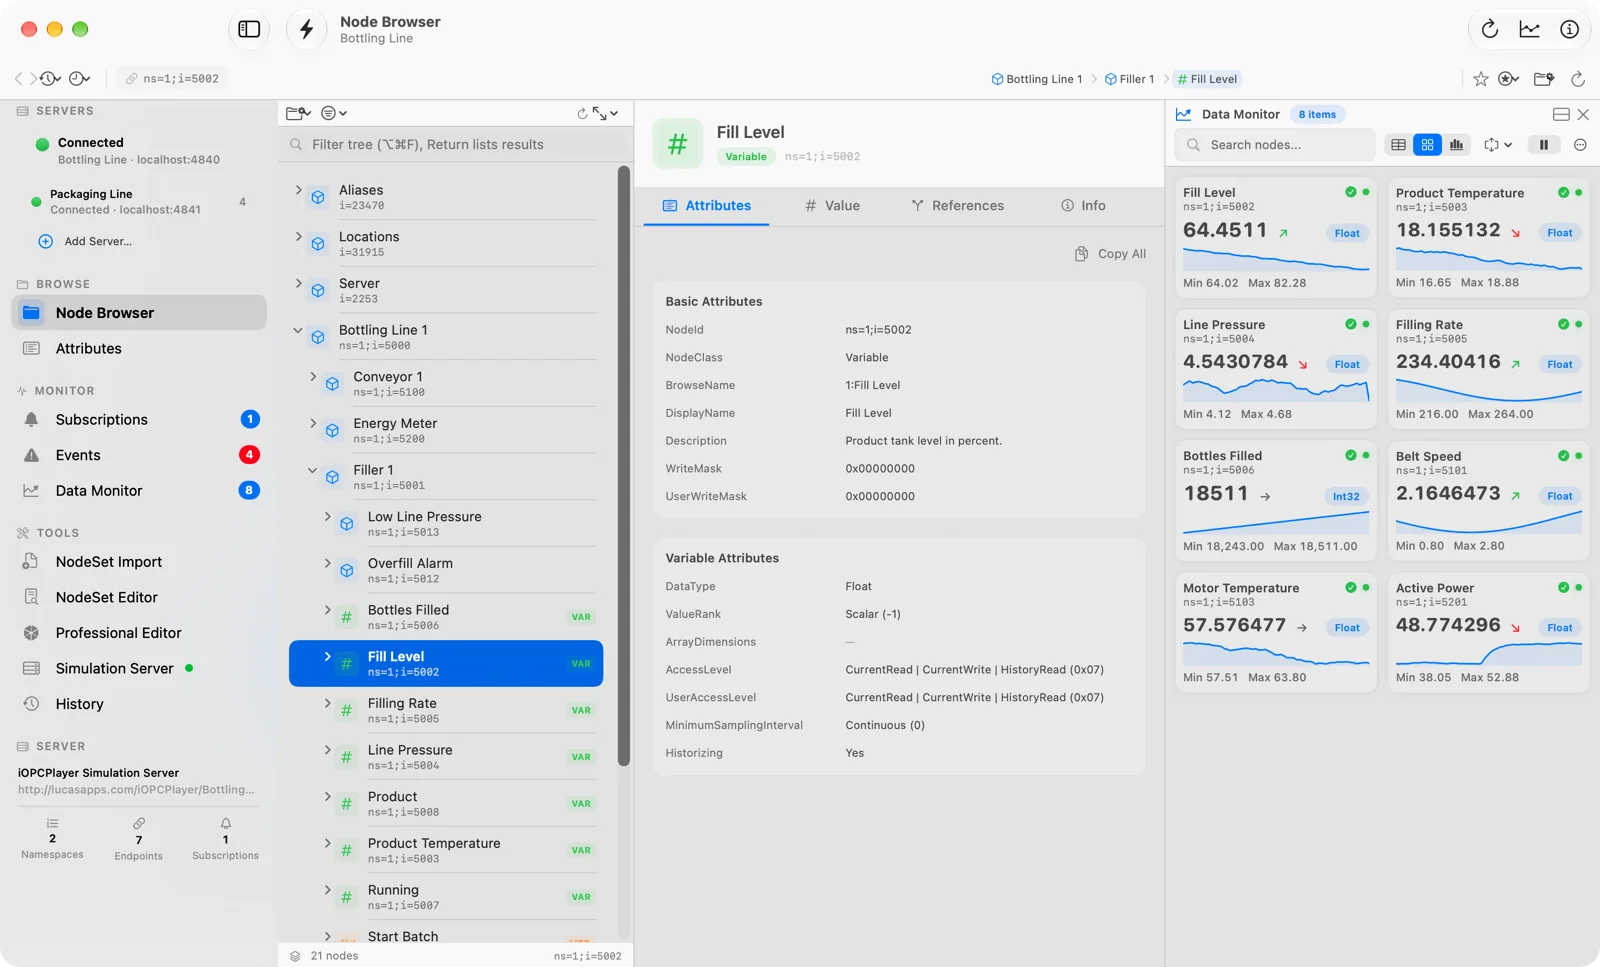
Hierarchical tree with an address bar for NodeIds, nsu= ids and browse paths such as /Objects/2:Line1, search across the whole server, per-server favourites, a references tab, back/forward navigation and type-hierarchy walks.
Attributes, read & write
All 22 standard attributes with a type-aware editor: Boolean toggles, steppers, date pickers, ByteString, NodeId, GUID, LocalizedText, and arrays for twelve primitive types.
Methods & programs
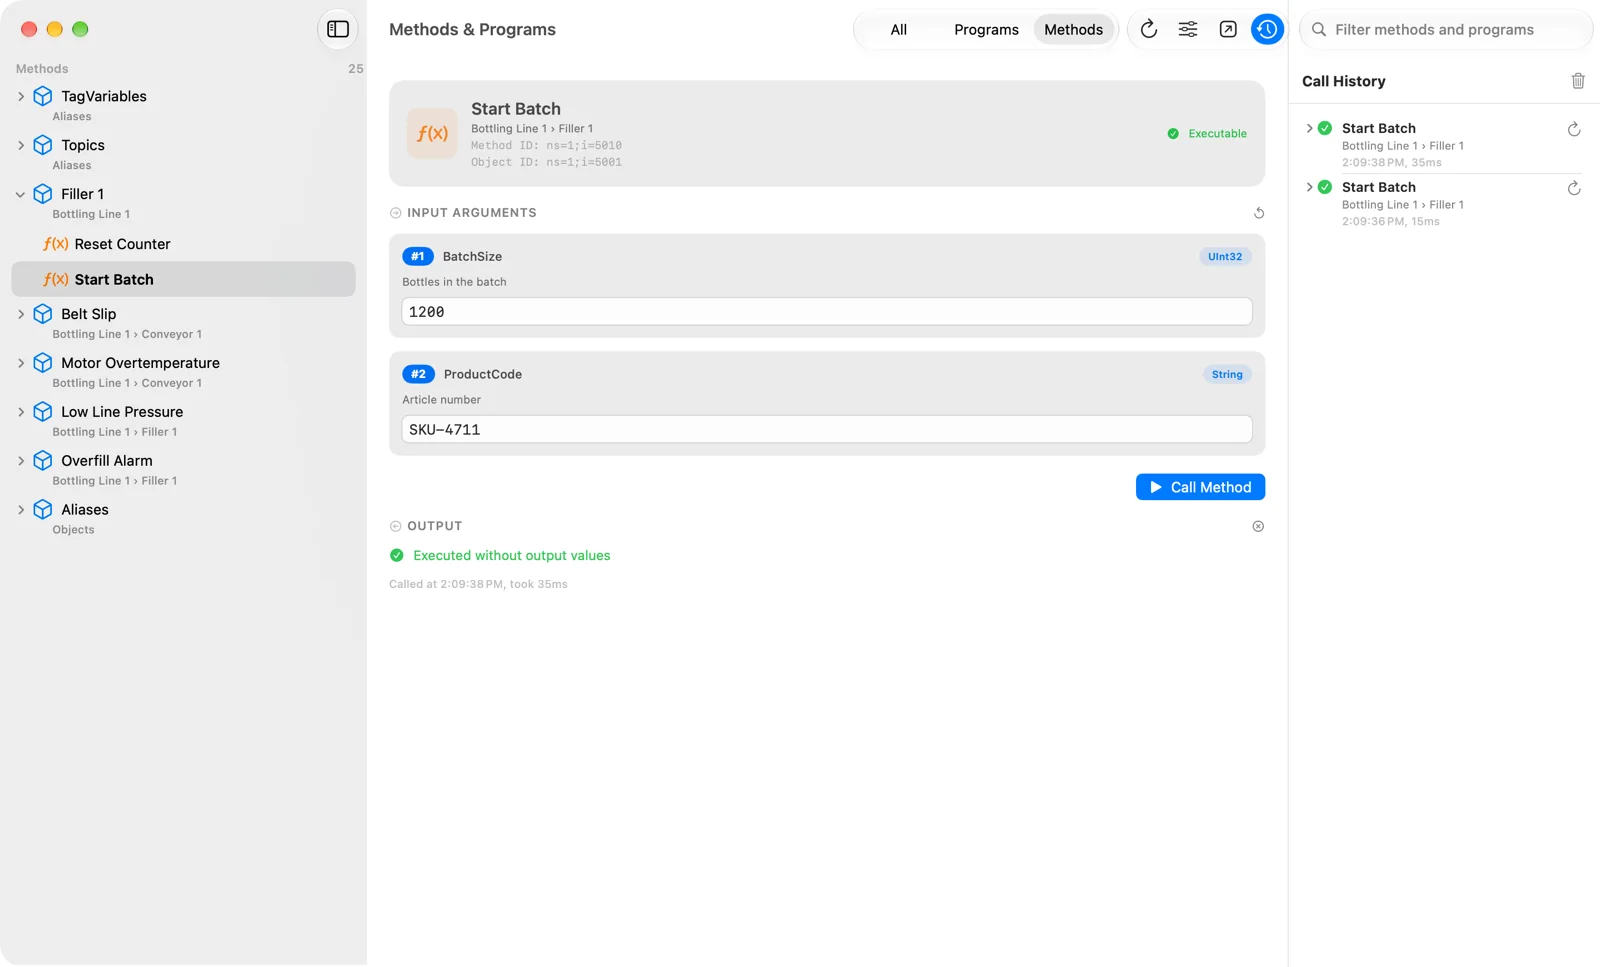
A typed form for every argument (including the server's own structures, enumerations and arrays) and a Methods & Programs window with live program state, every action and a call history.
Custom data types
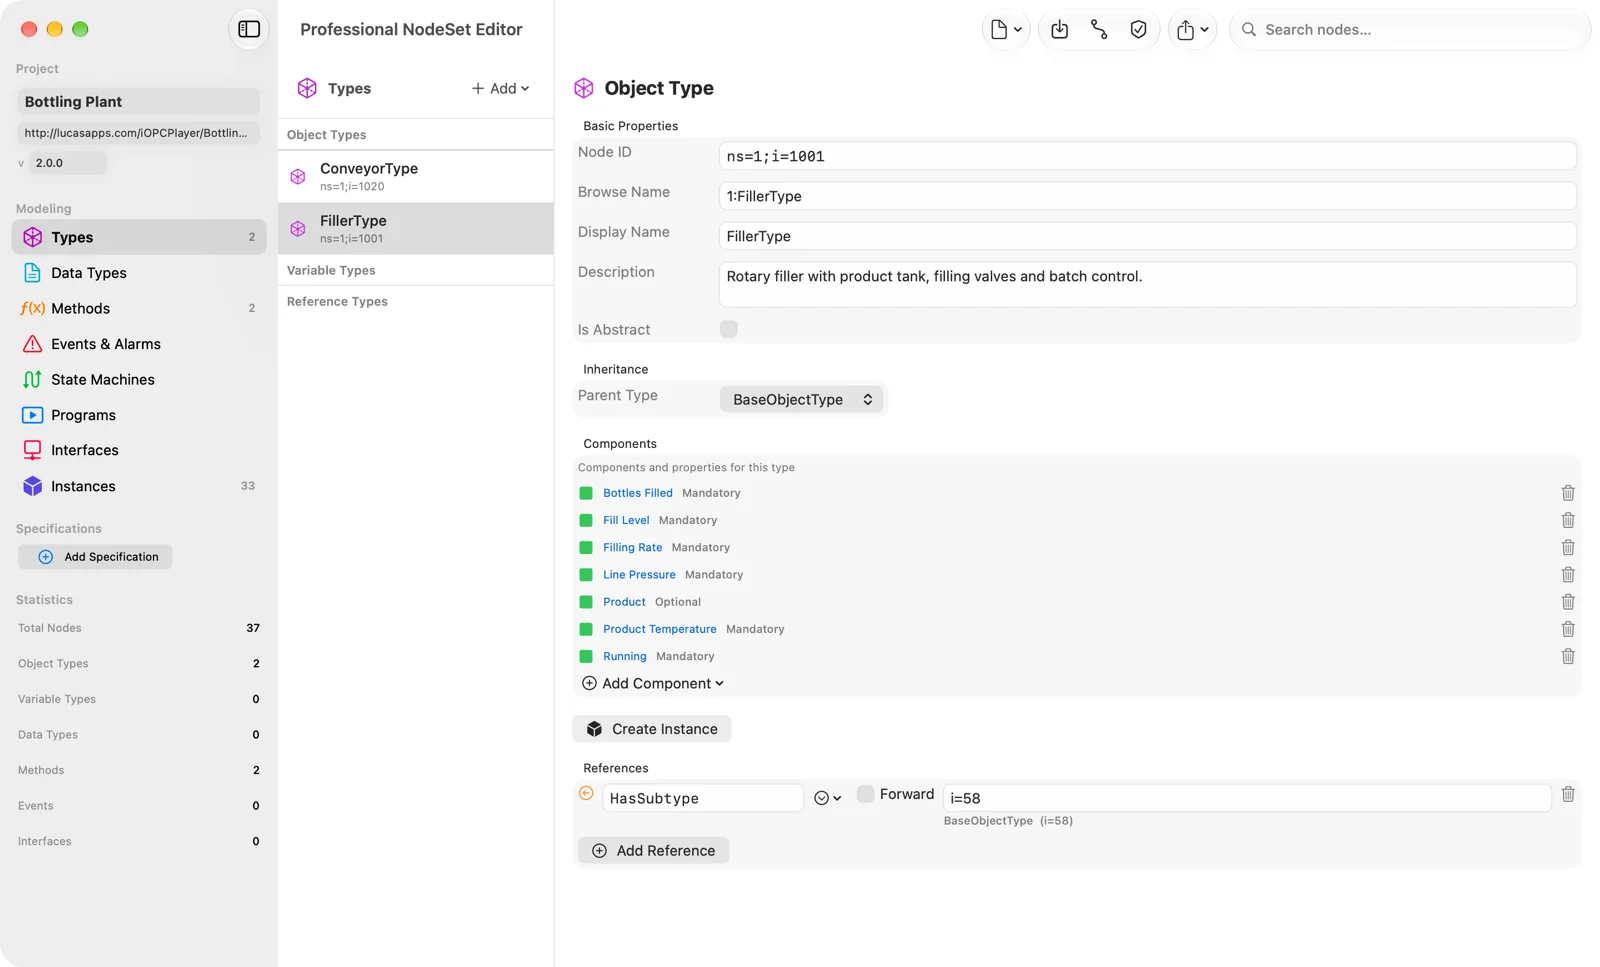
Structures, unions and enumerations defined by the server are identified automatically (DataTypeDefinition, or the type dictionary on older servers) and shown, written and passed to methods with all their fields.
Subscriptions & MonitoredItems
Full professional parameter sheet: publishing interval, lifetime & keep-alive counts, priority, per-item monitoring mode and DataChangeFilter deadbands.
Data Monitor
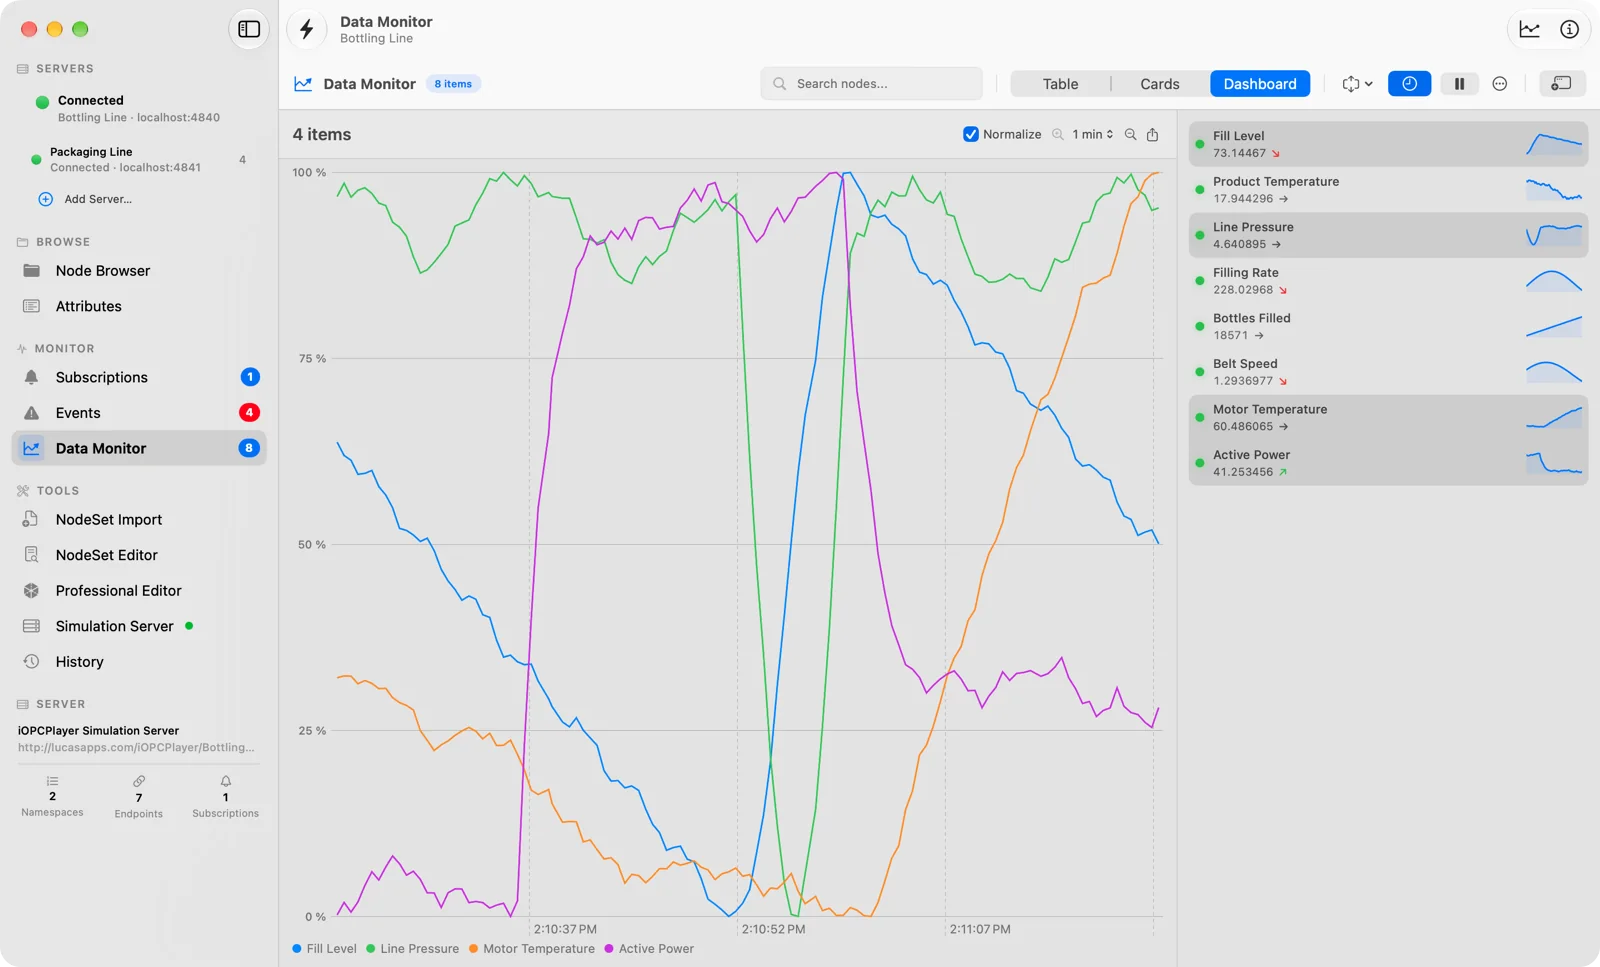
Cards, table and dashboard with sparklines and statistics. Drag nodes in (a whole object adds all of its data points) and keep it next to your work as a side or top panel, or in its own window.
Data points
Every variable of the server in one window with live values, filters, writing and change logging, plus the list of data types the server defines.
Events
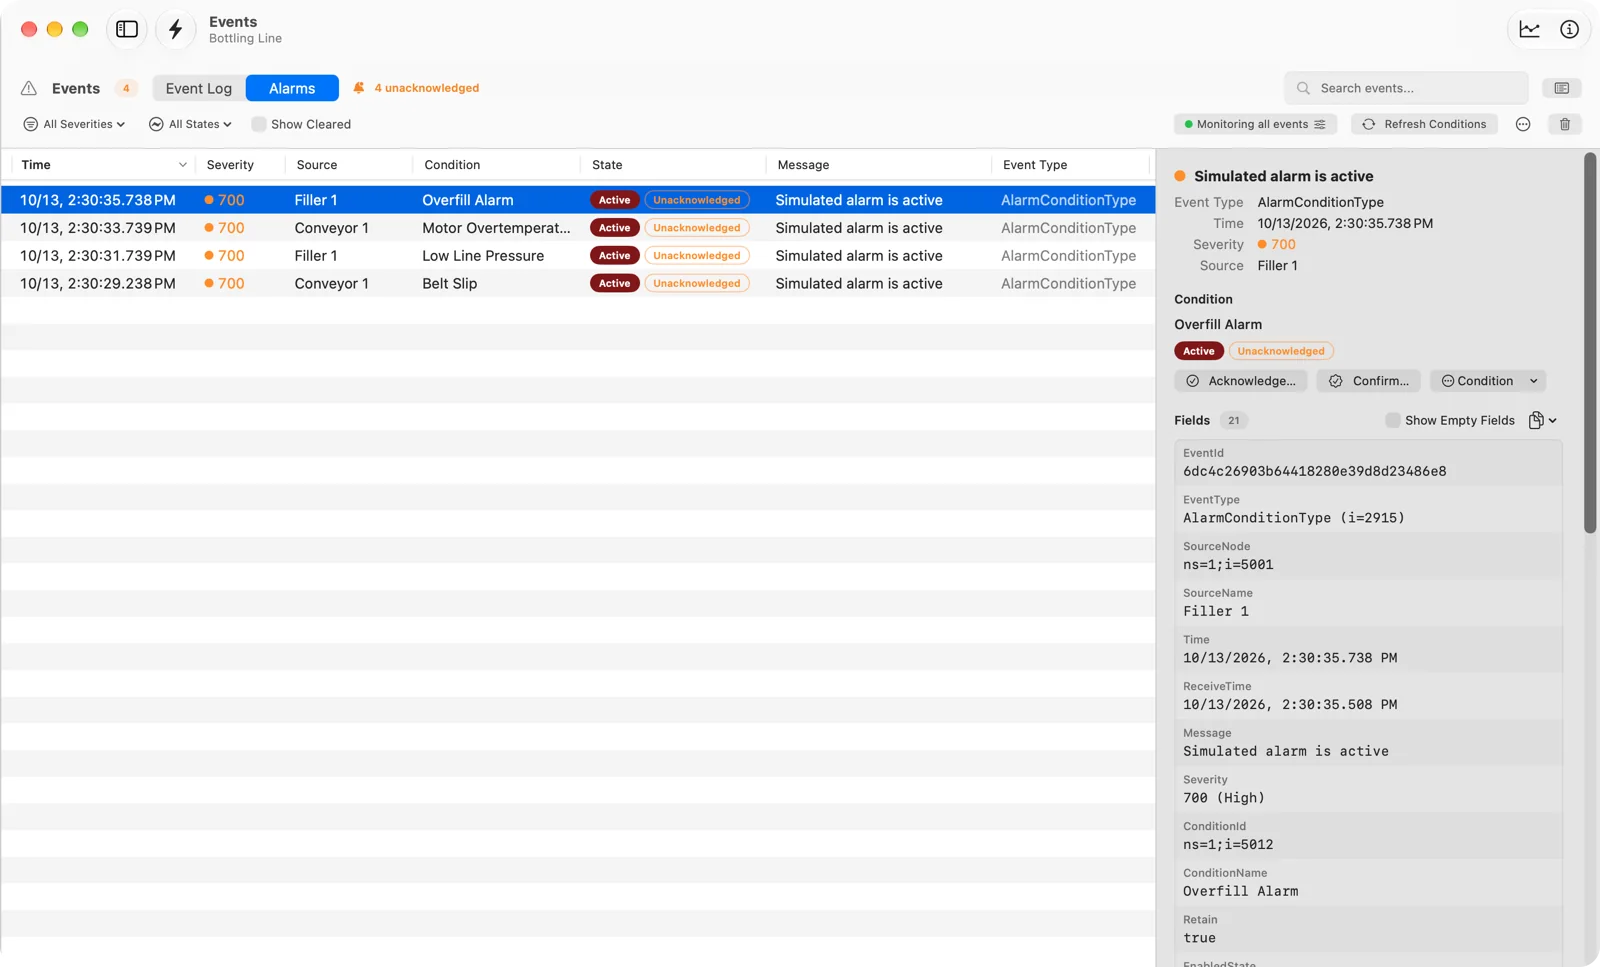
Server-side OfType and severity filters, the server's own event types and fields, and an inspector that shows every field of an event, with active/inactive, acknowledged and confirmed states.
Alarms & Conditions
An Alarms view with the current state of each condition and ConditionRefresh. Acknowledge (also several at once) and confirm with a comment, enable or disable conditions, and shelve them once or for 15 min, 1 h or 8 h.
HistoryRead
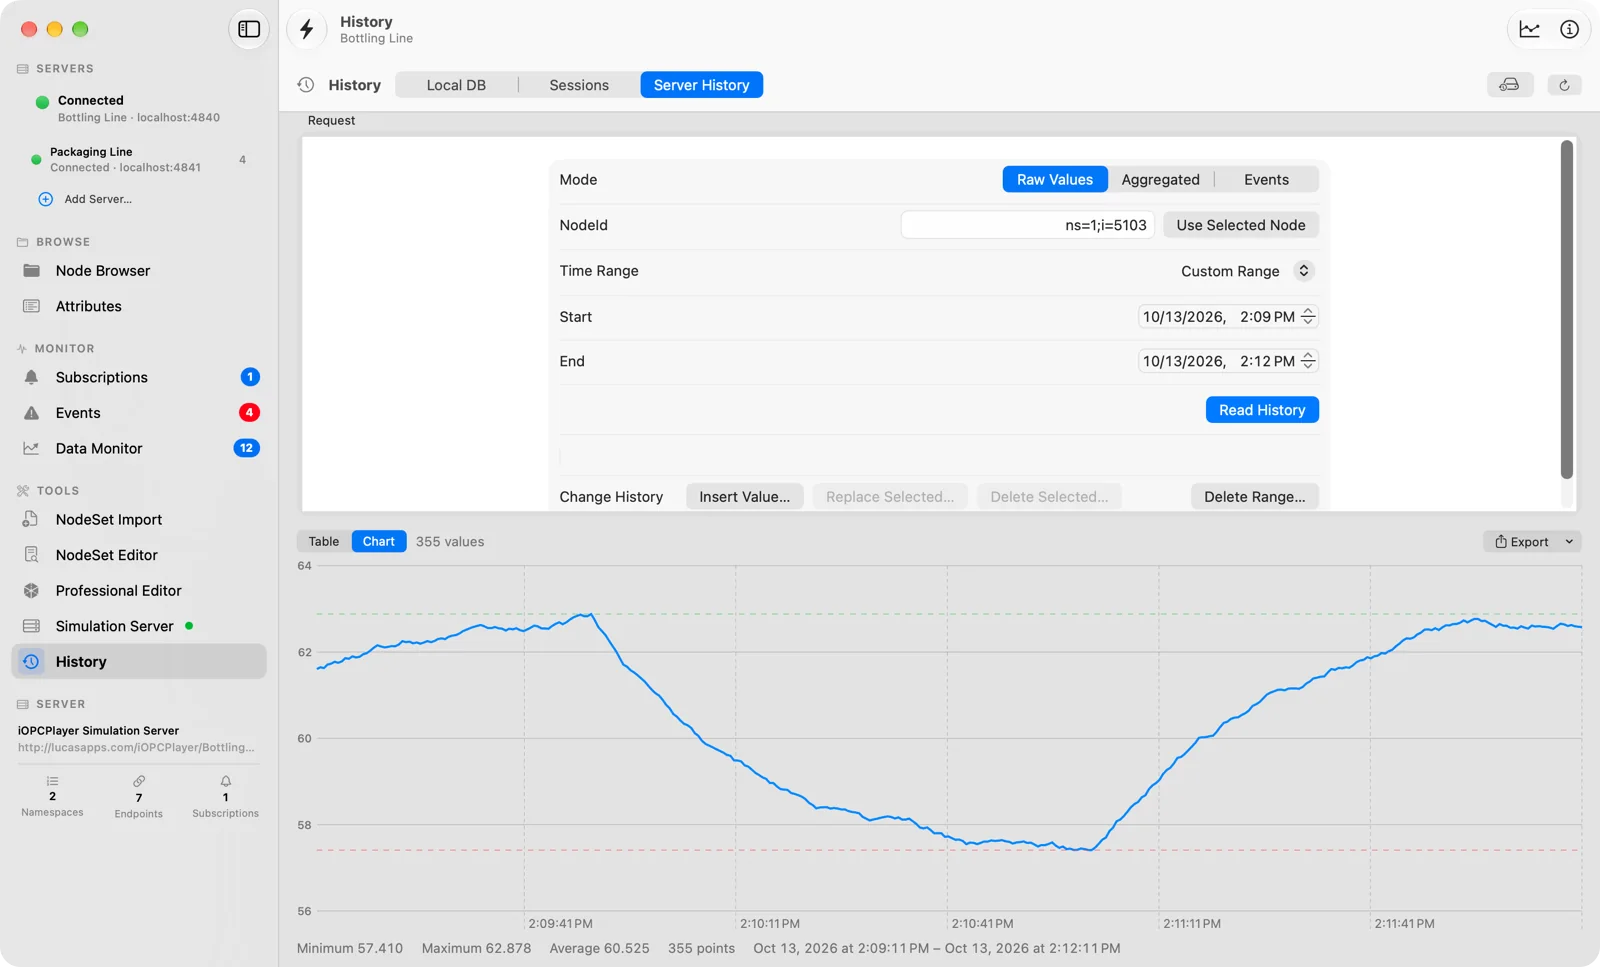
Raw values, historical events and server-computed aggregates (average, minimum, maximum and more per interval) via HistoryRead, with chart, Load More and CSV/JSON export, plus a server-vs-local toggle.
HistoryUpdate
Insert or replace values and delete raw time ranges on the server, straight from the History view, with a confirmation before anything is overwritten or deleted.
Session recording
Each connection can be recorded as a session in a local database (data changes, events, writes and method calls) with a timeline, notes and CSV/JSON export. Nothing leaves your Mac.
Query
Find every instance of a type with the OPC UA Query service. Experimental: servers without Query answer BadServiceUnsupported, and the app shows exactly that.
Performance test & long-run monitor
Benchmark reads 10 to 5000 times in a row, or watch a connection for hours: latency per interval, errors, notifications, drops and availability, with chart, event list and JSON/CSV export.
Multi-server stress test
Load several servers at the same time (3 minutes by default) with reads, browses and subscriptions in extra sessions. Per server: requests/s, p50/p95/p99 latency, errors, drops and a verdict, exported as JSON or CSV.
Server NodeManagement
Add objects and variables or delete nodes on the connected server via AddNodes / DeleteNodes, right from the browser's context menu, with a confirmation before deleting.
Simulation server & PubSub
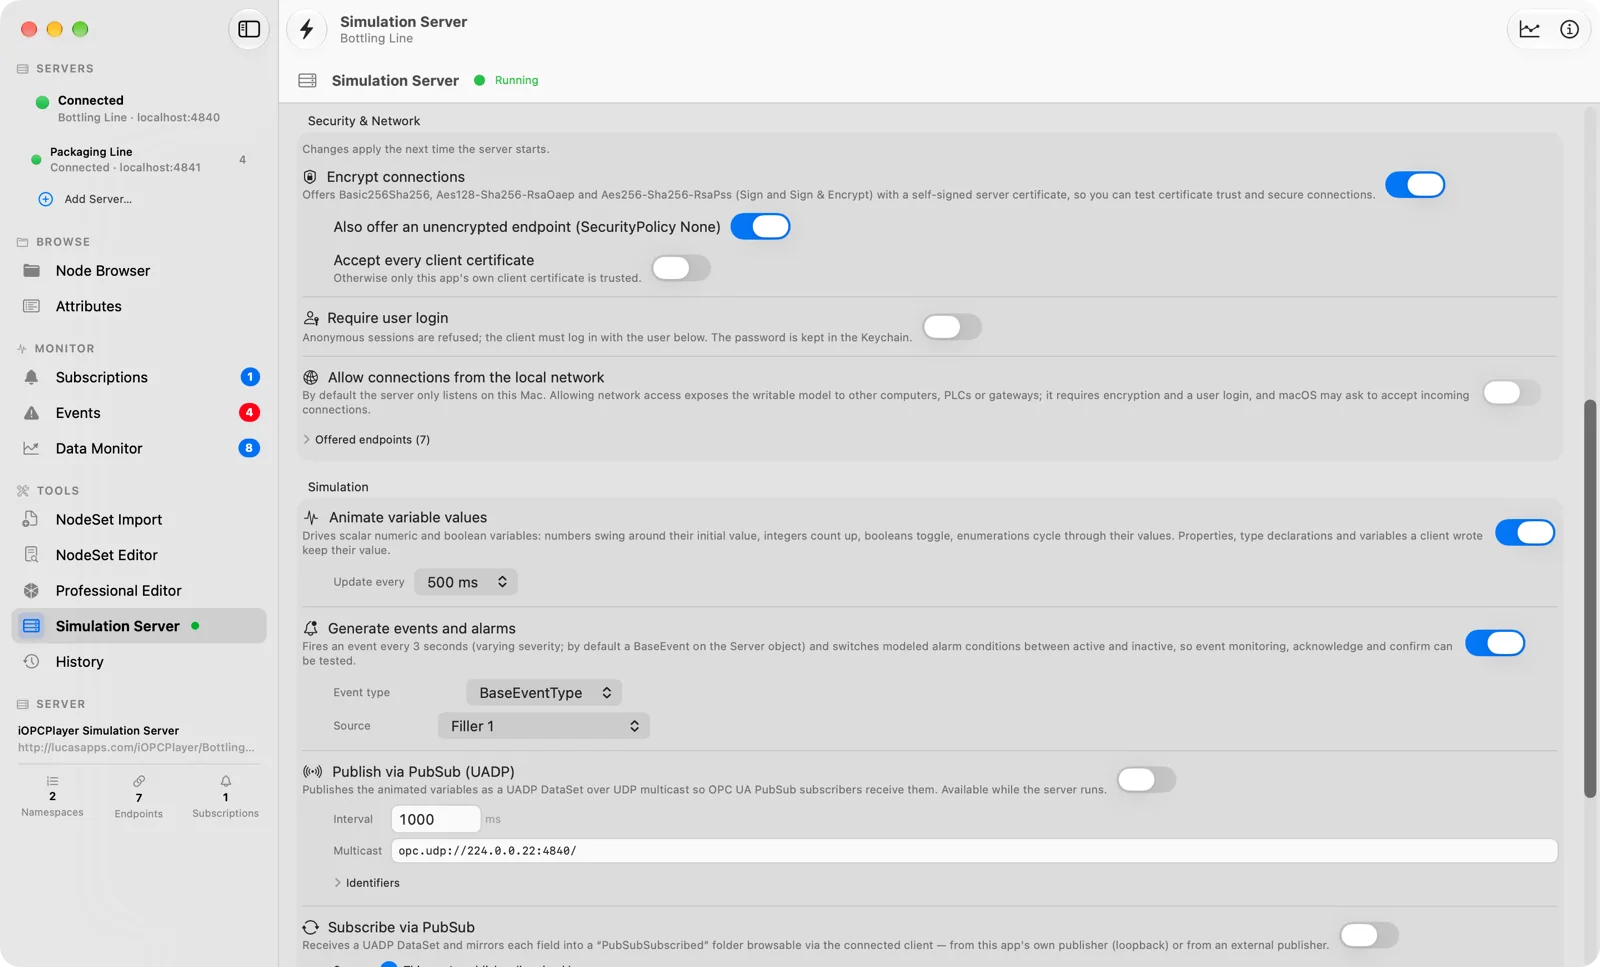
Host your model or the built-in demo in an embedded open62541 server with animated values, events, alarms and history, optional encryption and user login, and publish or subscribe via PubSub (UADP over UDP multicast). No external server required.
English & German
The complete interface and the built-in help are available in English and German and follow your Mac's language settings.
Stub honesty
Anything not fully wired returns the spec-correct BadServiceUnsupported instead of a fake Good, so the UI never misleads you.